Would you like to own a billion-dollar business? The answer depends on who you are and what else you’re doing with your time and money.
For most companies, a profitable, billion-dollar business would be a dream. For IBM in 2012, a company with $104 billion in revenue, their billion-dollar-a-year Point of Sale (POS) business was a distraction at best. It was a slow-growing, highly mature market. Profits were acceptable but flat. They sold the division to Toshiba so they could focus on their core business lines of hardware, software, and IT services.
There was absolutely nothing wrong with the IBM POS business. Practically every major retailer in the United States ran IBM cash registers. It was, in fact, a legacy of the company’s very first products in the early 1900s. By 2012, though, the company had changed. Their market had changed. Their strategy had changed. It was time for POS to go. The divestment provides a good example of the challenges of marketing portfolios.
Managing Product Portfolios
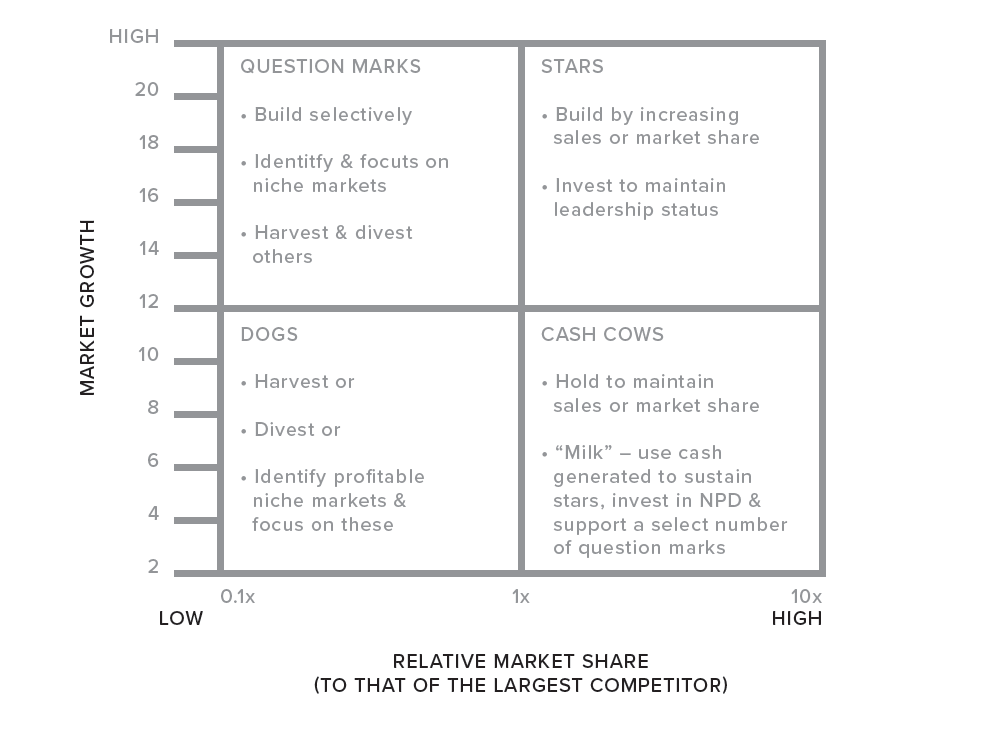
The management of portfolios of offerings has been the subject of considerable work by academic researchers, practicing managers and management consultants. For example, the Boston Consulting Group (BCG) has suggested the use of the two-dimensional matrix above for classifying product offerings based on the growth rate and market share.
In the BCG matrix, products are plotted based on the rate of growth of the market and their market share. Most often a high rate of market growth is defined as 10% annual growth and high relative market share is defined as twice the share of the nearest competitor, but different organizations often employ different definitions.
The underlying premise of the BCG approach is that different products, with different market characteristics, should be managed differently. Thus, a “cash cow” is a product with a high relative market share in a mature market that generates more cash than is needed for reinvestment back into its support. Therefore, such cows throw off cash that the firm can use for other purposes. Although the good people in Redmond might disagree with this assessment, Microsoft Office is a great example of a cash cow. The product line throws off somewhere along the lines of $12 billion a year. This cash flow is not going to slow down any time soon. The product doesn’t cost much to support. It has almost no competitors.
In contrast, a “star” has a high relative market share in a growing market. The need to support growth means the firm must reinvest the cash generated by the star in order to sustain its market share, and, hopefully, as the market matures the star will become a cash cow.
Smart phones provide an interesting case example of a product that is transitioning from star to cash cow. The iPhone is still a star, for sure, but the market is maturing and the innovation cycle is slowing down. There’s a perceptible decline in excitement about new iPhone models. Most people who want one already have one. It’s gone from a land rush market to a replacement market. Cash cow status is around the corner. Thus, Apple is looking for its next star. The Apple Watch was a candidate, but it may not become a star for a variety of market-based reasons, for example, not everyone wants an iPhone on their wrists.
“Dogs” have a small market share in a market that is not growing. Such products are typically not profitable and often are net consumers of resources. For this reason, dogs are candidates for divestiture. In the BCG view, the IBM POS business was a “dog.” It was not going to be a star, at least not at IBM. Another company might turn the cash register business into some cutting-edge mobile app wallet business, for instance, but that was not going to happen at IBM. POS needed to be divested.
Finally, there are “question mark” products, products in growing markets that have a small market share. The key question to ask of question marks is whether they can be turned into stars by increasing market share. If they cannot be transformed into stars they too should be divested.
Weaknesses In The BCG Model
The BCG matrix is based on the premise that market share drives margins and cash flow. Thus, it is important to invest in acquiring market share in growing markets so that as a market matures, and growth slows, the firm will have a product that generates more cash than is needed to support the product. It is simple and easy to understand. On the other hand, it is often criticized for being too simple. In addition, it is not always clear how a market and how market share should be defined. For example, is Coca-Cola in the soft drink business or the beverage business? The assumed relationship between market share and profitability is not always present.
Competitive pressures can neutralize margins as a market expands. The history of the hard disk drive industry presents a terrifying example. In the 1990s and 2000s, hard drive manufacturers put each other out of business making smaller, faster, and cheaper hard drives. Margins were flat. Capital investments were high. The market was exploding but few companies made any money.
Lastly, many products fit into a mid-range that is neither high nor low with respect to market growth rate and relative market share and therefore do not easily fit within the product definitions identified by four cells of the matrix.
Contributed to Branding Strategy Insider by: David Stewart, President’s Professor of Marketing and Business Law, Loyola Marymount University, Author, Financial Dimensions Of Marketing Decisions.
The Blake Project Can Help You Grow: The Brand Growth Strategy Workshop (NOW Online)
Branding Strategy Insider is a service of The Blake Project: A strategic brand consultancy specializing in Brand Research, Brand Strategy, Brand Growth and Brand Education


